Picks and Clicks: Understanding Field to Finish

This article originally appeared in the September 2011  issue of Professional Surveyor magazine.

Don’t be intimidated!

DEFINITIONSField to Finish—A general term used to describe the process of automatically drawing survey field data based on point descriptions and other field codes.Field Code (Description Key)—An alphanumeric code, corresponding to the point’s description, that defines how points are processed using Field to Finish. For points to be sorted onto a particular layer, be included in a point group, have a symbol inserted, or have linework that connects points be automatically generated, a Field Code having the point’s description must first be created.Field Code File (Description Key File)—A file that contains all of the Field Codes. 

Linework Codes—Codes entered before or after a point description that, when processed using Field to Finish, indicate where linework starts and ends or how to create additional, associated linework.

Somewhat like the seemingly Herculean task of developing CAD standards that I wrote about in the June issue, Field to Finish is one of those topics that almost everyone attending my workshops or training classes wants to learn more about. If they are not using Field to Finish, they think they should be—and, if they are already using it, they think they could be doing more or doing it better.

For those who are unfamiliar with it, Field to Finish is a general term used to describe the process of automatically drawing survey field data based on point descriptions and other field codes.


Depending on the survey software you use, Field to Finish may include some or all of these tasks:

  • insertion of survey points on to separate layers based on the point’s description,
  • sorting of points into point groups,
  • “tagging” of points, based on the point description, as “non-surface” points (this means that the points, even if selected, will be ignored when building a surface model),
  • insertion of a symbol onto a separate layer based on the point’s description or note,
  • rotation or scaling of a symbol based on the point’s description or note, and
  • drawing of 2D and/or 3D polylines connecting points based on the point’s description or note.

Although most survey programs can perform these or other tasks that fall under the Field-to-Finish header, to my knowledge, Carlson Survey is the only one to have commands or files that are actually named “Field to Finish.”


Land Desktop and AutoCAD Civil 3D use the term “Description Keys” for their feature that sorts points onto separate layers and inserts, rotates, and scales symbols. A separate feature called “Automatic Linework” or “Process Survey Linework” generates the polyline figures in these programs. For purposes of this article, Field to Finish refers to the generic term and, unless otherwise specified, applies to any survey program.

Benefits

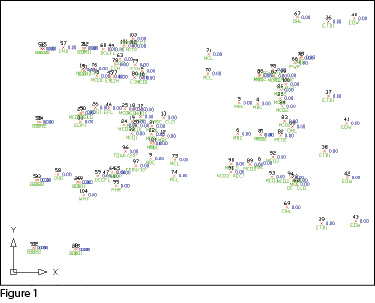
For those who have never used Field to Finish, it can be summarized in one word: intimidating! But once you see what can be accomplished with a little extra coding, I believe you’ll be convinced it’s worth it. Because a picture is worth a thousand words, it’s easier to show you the benefits of Field to Finish.

The generic command for importing points (rather than Field to Finish) was used to import the points in Figure 1. In addition to overlapping attributes that make it hard to read, the points are all on the same layer, making connecting the dots even more time consuming and difficult.


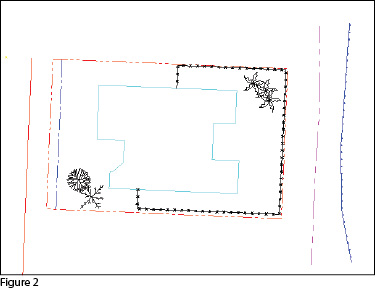
However, if you use Field to Finish to import the points into the drawing, it looks like Figure 2. The points have been frozen in this view, but you can see the symbols and 2D and 3D linework that have been generated on their proper layers.


Granted, these examples demonstrate the power of Field to Finish when used to its fullest capacity, and it does require additional time and attention in the field to generate these results. In my training classes I encounter a lot of skepticism from folks who don’t believe the extra time in the field is worth it. While it may look cool, they say, it’s just easier to sort to layers, insert symbols, and connect the dots manually back in the office.

Bite-size Pieces

I respectfully disagree—and I believe that tackling significant changes in procedure is best accomplished with bite-size pieces rather than one big bite. Do you remember how you’re supposed to eat an elephant? One bite at a time, of course!

  • Nibble: Sort points onto separate layers and into point groups.
  • Snack: Tag points such as fire hydrants and inverts of manholes as “Non-Surface” points.
  • Bite: Specify symbols to be inserted on points where needed.
  • The whole enchilada—er—elephant: Also use special linework codes to connect points using lines or 2D polylines (for plan generation) and 3D polylines (for defining breaklines for surface models).
Point Description ConsistencyRegardless of the level of Field to Finish automation you strive for, the single biggest key to success with Field to Finish is consistency among the point descriptions. If you are attempting to implement Field to Finish for the first time and want to ensure buy-in from your field crews, allow them to help develop the list of descriptions. After all, they are the ones having to enter them in the field. If the folks in the field are not consistent with the descriptions they enter for each shot, Field to Finish is doomed to fail.For instance, in the office, it doesn’t matter whether the description for a fire hydrant is “FH,” “HYD,” or “FIRE HYDRANT.” Once the Field Code File has been created, it’s simply a matter of processing the Field to Finish routine. So, rather than someone in the office dictating what descriptions the field crew should use, ask the crew what description makes most sense to them and what they are confident they can remember and enter every single time.


Even though the “nibble” part seems simple enough, it still requires a considerable amount of thought and consideration. So, how do you start? First, determine what descriptions will be used for shots taken in the field. In order to use Field to Finish, you will need to create a field code for each description that may be processed now or in the future.


Start by going back to one or two of the largest point files you’ve worked on recently and sort it out based on the point descriptions in it. Use this list as a guide to determine what descriptions to keep and what to throw out and also to trigger your memory for other descriptions that may be used in the future.


Once you’ve completed your list of descriptions, each description must be defined as a Field Code (Description Key) in the software. It’s during this step that layers can be assigned for the points, symbols can be specified for insertion, point groups can be defined, and non-surface points can be tagged. Depending on the software you use, the dialog boxes and interface will be different, but the data and settings entered are generally the same.


For Carlson Software users, there is a routine in the “Draw Field to Finish” dialog box that automatically creates a Field Code Table (populated with Field Codes) from a Coordinate File. If you’re not using Carlson Survey, I recommend opening your point file in Microsoft Excel to sift through and sort the list of descriptions.


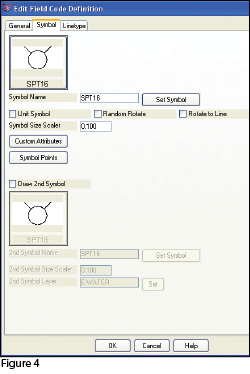
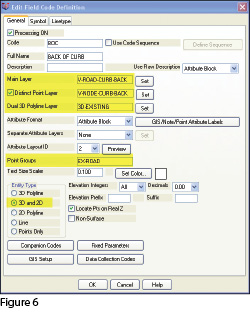
The Field Code that processes points with an FH description, as defined in Carlson Survey 2012, is shown in Figure 3. On the “General” tab of the dialog box, note the highlighted areas that show the layers, point group, and the checkbox to tag points as non-surface. Importing points with an FH description and using the “FH” Field Code definition results in the symbol named SPT16 being inserted on the layer V-WATR-STRC, the point being inserted on layer V-NODE-WATR-STRC, and the point included in a point group named EX-WATER.


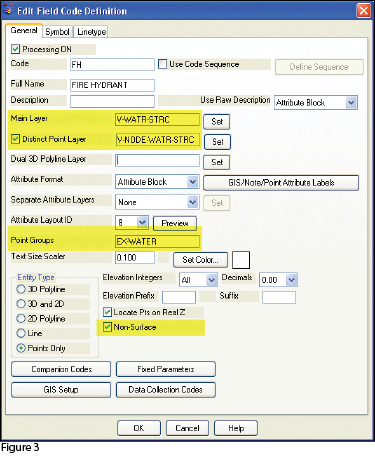
The “Symbol” tab of the dialog box (Figure 4) is where you specify the symbol name and various other rotation, scale, and insertion settings.

Connecting All Your Points

As I stated previously, it’s a reasonable goal to get to the point where Field to Finish is used to sort points and/or symbols onto their proper layers and into point groups and to tag some points as non-surface to keep them from being included in a surface model. These are office-only tasks, because using Field to Finish to complete them does not require anything from the field crew other than consistency when entering point descriptions.However, the ultimate goal is having Field to Finish connect all of your points with 2D and/or 3D linework. Compared to the previous tasks, this requires more buy-in from the field crew because of the additional coding and noting.


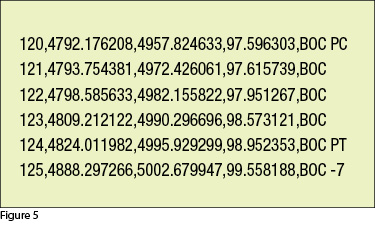
In Figure 5 you can see the linework coding that has been added to the “BOC” (Back of Curb) point descriptions in the sample of the point file. The “+7” linework code instructs the program to begin drawing linework, and the “-7” instructs it to stop drawing that piece of linework. The “PC” and “PT” identify the starting and ending points of a curve that fit all points in between the PC and PT.

The Field Code that processes points with a BOC description is shown in Figure 6. If you use the linework codes from the point file along with the BOC Field Code definition, it results in a 2D polyline on layer V-ROAD-CURB-BACK that starts at point 119 and goes to point 120. Then it goes into a curve that best fits between points 120 and 124 and ends with another tangent line from point 124 to point 125. A 3D polyline connecting the same points will also be drawn on layer 3D-EXISTING. In addition, the points will be inserted on layer V-NODE-CURB-BACK and included in a Point Group named EX-ROAD.


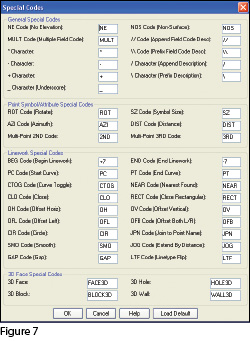
And this is just a sample of what can be done using Field to Finish. Depending on your software and data collector firmware, there are many other linework codes that can be used to automate the creation of linework based on your point descriptions and notes. In some cases there are specific linework codes that must be used, such as “B” for Begin linework (instead of the +7 used above) or “E” for End linework (instead of -7). Other programs, like Carlson, allow you to customize these codes. The “Special Codes” dialog box in Figure 7 shows the default linework codes used in Carlson Survey 2012.


I have one last piece of advice for those who are considering jumping into the world of Field to Finish for the first time. Cheat! Well, kinda. Every survey program with a Field to Finish feature has sample files that you can use as-is or modify to meet your needs. Rather than starting from scratch, it’s sometimes easier to work with one of those prepared files.


As always, I encourage you to send your feedback or contact me with questions at [email protected].

This article originally appeared in the September 2011 issue of Professional Surveyor magazine.


What is Carlson up to?

This is a good article about Bruce Carlson and where Carlson Software is planning to go in the future…

Independence All the Way

Originally posted on Carlson Connection by Jennifer Dibona


Carlson Software Manuals

Looking for Carlson Software manuals? Prior to the 2010 release, Carlson included printed manuals with your purchase and, in addition, the manuals have always been available to print for yourself from the Help files.

With the 2010 release, Carlson “opened” a storefront on the self-publishing site called Lulu.com. You can order 2009 and 2010 Carlson Software manuals here http://stores.lulu.com/carlsonsw.

Originally posted on Carlson Connection by Jennifer Dibona


Export IntelliCAD or AutoCAD DWG files to Google Earth

I’ve recently started using a very cool feature in Carlson Software. The bad thing… it was in the 2009 version and I didn’t even realize it!

I had no idea exporting our DWG files from IntelliCAD or AutoCAD out to Google Earth was so easy.

  1. Download and install Google Earth. You can download it here: http://earth.google.com/
  2. Open any one of your project DWG files that has been positioned at its correct state plane coordinate system.
  3. In Carlson, go to Settings –> Drawing Setup and then select the correct Projection and correct Zone for the project site. If you’re not sure of the Projection, try using “State Plane 83”. This will work for most systems.
  4. Next, go to File –> Polyline File –> Write Polyline File. When prompted for “Polyline File Format”, type “G” for Google. You will be prompted to specify a new filename and save location for a “Google Earth File to Write (.kml)”.
  5. You will then be prompted to select the entities that are to be exported out to the .kml file and viewed in Google Earth. After selecting the entities, press Enter. For this exercise, we only want to see the drawing entities in 2D, so press “N” for “No” when prompted to “Use elevation from drawing in Google Earth [Yes/<No>]?”
  6. Finally, you are then prompted “Would you like to display the file in Google Earth now [<Yes>/No]?”. Press “Y” for “Yes”. Google Earth should automatically launch and zoom into the project location.

In the example shown below and pointed out with arrows, notice how closely the new roads and designed turn lanes match up to the existing roadway. Also, you can see the designed graded slopes perfectly avoiding the tank that is to be preserved during construction.
Not too shabby…

This feature is available in all of the Carlson Desktop products: Carlson Civil, Survey, Hydrology, Construction and TakeOff.

Look for a future post on bringing Google Earth surface data into Carlson Software. Hint: It’s easy too!

Originally posted on Carlson Connection by Jennifer Dibona


Carlson Webinars – BIM, GIS and CAD Standards

Carlson Software recently asked Felicia and me to present webinars on topics we have particular interest in or specialize in. 

Felicia’s webinar on BIM, GIS and Carlson Software can be viewed here: BIM, GIS and Carlson Software Webinar

My webinar on CAD Standards can be viewed here: CAD Standards for Carlson Software with AutoCAD or IntelliCAD

Originally posted on Carlson Connection by Jennifer Dibona


Carlson-IntelliCAD GIS Starter Kit from ESRI

Those currently using Carlson with IntelliCAD are eligible for a new “GIS Starter Kit” from ESRI. The Kit includes:

  • ArcGIS ArcView desktop software
  • A copy of the book A to Z GIS: An Illustrated Dictionary of Geographic Information Systems
  • A copy of GIS Tutorial: Workbook for ArcView 9, Third Edition
  • A 10% discount for the ESRI Survey & Engineering GIS Summit ($325 – standard registration price)

To take advantage of the offer, call 1-800-GIS-XPRT (1-800-447-9778) and request the Carlson-IntelliCAD GIS Starter Kit and please have your Carlson Serial Number available.

You can read more about ESRI’s commitment to survey and engineering services by visiting http://www.ESRI.com/engineering.

Originally posted on Carlson Connection by Jennifer DiBona


Working with Land Desktop or Civil 3D Contours in IntelliCAD-based Carlson Programs


If you are working in an IntelliCAD version of  Carlson Survey or Civil and need to bring in surface entities (contours) from a Civil 3D (C3D) or Land Desktop (LDT) drawing, it’s actually very easy to do. However, it’s not necessarily easy to find on your own. And, unfortunately, it’s in a slightly different place depending on whether you’re using the Carlson Survey or Civil menu.

FYI – If you simply try to “Open” a drawing that has AECC Contour Objects with an IntelliCAD-based program, it may look correct, but the entities will only be the dreaded “ACAD PROXY OBJECTS” that have bogus elevations. These are only good to look at… not work with.

Whether you’re using Survey or Civil, the only thing you’ll need is a drawing file (DWG) containing the C3D or LDT contours for the surface. It doesn’t even need to be opened, you just need to have it and be able to find it. (hey, I’m getting old!).

First, start a new drawing in Carlson.

Then, if you’re using Carlson Civil:

  1. Go to the “Surface” menu,
  2. Select  “Import/Export Surface”
  3. Then, select “Convert LDT/Civil 3D Surface Drawing”.

If you’re using Carlson Survey:

  1. Go to the “Surface” menu,
  2. Select “Import/Export Surface Data”
  3. Then, select “Convert Civil 3D Surface Drawing”.

Next, you’re prompted to “Select the LDT/Civil 3D Drawing to Read”. After browsing to and selecting the LDT or C3D file, pick “Open”.

Next, you’re prompted to to “Select Converted Drawing to Write”. This will be a new DWG file containing the converted data. After browsing to a new location and specifying a new file name, pick the “Save” button.

You’ll see the conversion process in the text window. Once finished, you can open the converted drawing.

What you will find in the new drawing are all of the entities from the original LDT/C3D drawing except that any AECC Contour Objects have been converted to elevated PLINEs and LINEs.

The first step you’ll probably want to take after opening the new drawing is to join together all of the contour PLINEs and LINEs. You may want to “Isolate” the layers for the contours first.

Then use the “Join Nearest” command under the “Edit” menu. Like most cases, make sure to have the “Join Only Common Elevations” and “Join Only Common Layers” options selected.

Originally posted on Carlson Connection by Jennifer Dibona


Coming in Carlson 2010

I’m not privy to the “official” list of coming updates, but I can share a few things that I know will be in the next release. Most of these come from “wishlist” items I have submitted on behalf of my clients.

The folks at Carlson are welcome to add their 2-cents in the Comments of this post or on Direct From Carlson.

Option for placing building footprint a distance off the building setback line.

Currently, the LotNet command places the building footprint exactly on the midpoint of the building setback line. We heard the request several times to have the option of placing the footprint some distance behind the setback line. It will be in the 2010 release.

C & G Survey

Instead of having two separate survey programs, Carlson will be incorporating C & G as a separate set of menus in Carlson Survey in 2010.

Basic IntelliCAD Menu

If you’re running Carlson on top of an AutoCAD-based program, you have an icon or menu option to switch over to an AutoCAD menu that has basic Draw commands such as line, pline and text and basic Modify commands such as copy, explode and pedit. Although it’s not easy to get to right now, IntelliCAD has a similar set of menus and toolbars. Carlson 2010  stand-alone with IntelliCAD will have a menu item and toolbar icon allowing you to easily switch over to the IntelliCAD menus and then back again to the Carlson menus.

Lookup table of curb slopes for super-elevation transitioning

This new feature will handle curb transitions like those shown in this NC DOT detail drawing.

Originally posted on Carlson Connection by Jennifer Dibona


Large Companies DO Use Carlson – Dewberry Presenting Implementation Case Study at Conference

Carlson Software put out a press release this week announcing that a representative of Dewberry will be making a presentation at the User Conference about their recent implementation of Carlson Survey and Civil Software.

This is a good supporting argument for my Myth #7 about how large companies DO use Carlson.

Click here for the press release about Dewberry.

Originally posted on Carlson Connection by Jennifer Dibona


BIM this, BIM that… What is BIM?

 Q:     What is BIM? And, exactly how does it relate to the civil engineering industry?

 A:     BIM, by definition, has nothing to do with civil engineering.

BIM stands for “Building Information Modeling”. The term “BIM” originated in the Architectural world and, generally, defines the process of inputting information to and extracting information from a 3D model of a building/facility.

Definition of BIM from the National BIM Standard:

BIM is best thought of as “a digital representation of physical and functional characteristics of a facility…and a shared knowledge resource for information about a facility forming a reliable basis for decisions during its life-cycle; defined as existing from earliest conception to demolition.”

From the National Institute of Building Sciences:

Building Information Modeling (BIM) refers to the use of the concepts and practices of open and interoperable information exchanges, emerging technologies, new business structures and influencing the re-engineering of processes in ways that dramatically reduce multiple forms of waste in the building industry. The National BIM Standard, a key element of the overall industry transformation being supported and coordinated by the buildingSMART alliance™, establishes standard definitions for building information exchanges to support critical business decisions. Implemented in software, the consensus-based standard will form a basis for more accurate and efficient commerce within the capital facilities industry. The National BIM Standard is also intended to help participants in facilities-related processes achieve more reliable outcomes from commercial agreements.

From Geomatics International:

A Building Information Model (BIM) is a digital representation of physical and functional characteristics of a building. Construction and management of buildings involves many stakeholders, so that proper sharing of information over the entire lifecycle of a building is very important. The Open Geospatial Consortium (OGC) is developing BIM standards that promote efficient web-based information sharing in the Architectural, Engineering, Construction and building Ownership and Operation (AECOO) markets.

Because Wikipedia is open-source and able to be edited by anyone and everyone, the entry for BIM changes regularly. The entire entry looked like this as of February 26, 2009. Here is an excerpt:

Building Information Modeling (BIM) is the process of generating and managing building data during its life cycle[1]. Typically it uses three-dimensional, real-time, dynamic building modeling software to increase productivity in building design and construction.[2] The process produces the Building Information Model (also abbreviated BIM), which encompasses building geometry, spatial relationships, geographic information, and quantities and properties of building components.

A lot of confusion is now occurring because Autodesk and their civil resellers are trying to make the connection between BIM and Civil or, more specifically, Civil 3D. See examples here:

BIM for Civil Engineers by Sanjay Asnani, Autodesk
  If link doesn’t work, find this document HERE.

What Does BIM Mean for Civil Engineers? by Adam Strafaci, Autodesk

Civil 3D and BIM… How do they relate? by Melanie Santer, US CAD

However, if you simply Google “bim building information modeling” and look at the first two pages of returns, the only entries that attempt to connect BIM and civil engineering belong to Autodesk or one of their civil resellers. All other hits refer to BIM in an architectural/building sense. If there is a specific software program mentioned, it is Autodesk’s Revit product. A caveat to this is the civil/structural engineering specialty field of bridge construction which can also be modeled using Revit. Bridge construction is a bit of a hybrid in that it is similar to building design and can also legitimately be related to BIM.

Among Autodesk’s architectural team and resellers, most, if not all, references to BIM are solely in an architectural/building capacity. See examples here (pages were cached on 2/26/09):

Brave New BIM

The World According to BIM – Part 1

Summit AEC – Autodesk BIM & CAD Software

As you can see from the above links, it is technically incorrect to connect BIM and Civil. However, many in the civil world are witnessing the Autodesk definition of BIM take hold. So, in the event you are ever asked or required to “BIM” a civil project, you are essentially being asked to design and deliver a dynamic, 3d model of the entire project.

It is important to realize that creating a dynamic 3d model for a Civil project (or “BIM”ing a civil project) is not limited to using a particular software program.

Find a civil engineering design software that allows you to design to specific criteria, is able to show a great visual representation of all the components of your project in 3D view and is able to dynamically reflect changes and you can “BIM” along with the rest of the world.

Designing a project using a dynamic model allows you to design according to specific criteria such as AASHTO (American Association of State Highway and Transportation Officials) standards or by specifying minimum/maximum values for storm or sanitary sewer design. It also is invaluable to detect, before construction, potential conflicts between a proposed network of roads and associated utility networks. As an example, a dynamic 3d model would trigger a warning if, when lowering a roadway, the rule for minimum cover over a pipe on an adjacent roadway has been violated. Also, creating this model allows you to view the model, make changes to vertical alignments and see dynamically updated cut/fill quantities all at once.

To reduce the confusion, it might be time to coin a new term such as “Site Information Modeling” to describe the process in the Civil industry. But, there is still quite a disparity between the “Information Modeling” done for a Building compared to that done for a Civil project. In true BIM, the “I” (Information) component is as important as the “M” (Modeling) component because determining usability and functionality of the Building through its lifecycle is one of the goals of BIM. At this time, the process on the Civil side is still much more about the “Model” and not nearly so much about the “Information” going into and coming out of the model. When we are able to incorporate results of traffic flow analyses for a roadway or inspection reports showing sludge build-up and flow capacities in sewer/storm pipies and manholes, we will be truly using the “Information” as it was intended in an “Information Model”.

Originally posted on Carlson Connection by Jennifer Dibona